Working With Data from Tucson Bird Count
Tucson Bird Count (TBC) is a cooperative project between scientists, environmentalists and bird enthusiasts in Tucson with two objectives. The first is to look for long-term changes in bird populations in Tucson as development continues at a rapid pace. The second is to locate areas in Tucson that support a high diversity of native bird species and to find out what is special about those areas with the hopes that this information can be used to increase bird diversity in other areas in Tucson.
View the following for more detail on the TBC and birding in the Sonoran Desert
 View Tracking Bird Diversity in Arroyo Chico with the Tucson Bird Count
View Get Inolved in Sonoran Desert Birding
Activity
Working With Real Data
Tucson Bird Count (TBC) is a cooperative project between scientists, environmentalists and bird enthusiasts in Tucson with two objectives. The first is to look for long-term changes in bird populations in Tucson as development continues at a rapid pace. The second is to locate areas in Tucson that support a high diversity of native bird species and to find out what is special about those areas so that development practices that are least harmful to wildlife can be implemented.
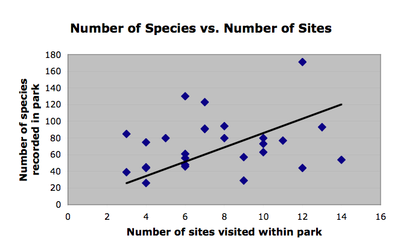
We will use the data collected by volunteers over the past six years from 27 parks to illustrate how sampling affects our estimates of species diversity. We have three variables: 1) the number of sites visited within a park; 2) the number of times a park was visited; 3) the number of species recorded within a park. Our task is to describe the relationship between the first two variables and the third variable. To do this we need to graph the data.
The graph that you will create is called a scatterplot because the data points are scattered between the x and y axes. A scatterplot is a convenient way to visualize the relationship between two variables. We have both an independent (X) variable and a dependent (Y) variable. The level of a dependent variable depends on the level of the independent variable. In our case, the number of species (dependent variable) recorded by the volunteers depends on the number of sites (independent variable) visited by the volunteers.
Why? Think back to our discussion of habitats. Since each species has its own unique habitat requirements, the more habitats that are sampled, the more species we will find. Ten or more sites were visited within some of the parks, but in other parks fewer than five sites were visited. In which parks do you think volunteers will have recorded a higher number of species? Can you make a hypothesis about the relationship between our two variables (the number of sites visited within the park and the number of species recorded in the park)?
STEPS TO MAKING THE GRAPH WITH EXCEL:
- Open the excel workbook titled TBC_Park_Summary. There you will see the data collected from 27 different parks in Tucson. The first column gives the names of the parks. The second column (Sites) tells you how many sites inside the park were visited. The third column (Visits) tells you how many times the park has been visited. The last column (Species) tells you how many species have been recorded in the park.
- Copy the Sites column and paste it on a new worksheet. Then go back and copy the Species column and paste it exactly next to the Sites column.
- Highlight these two columns. Then click on the chart wizard icon at the top of the window. You now have to choose which type of graph you would like to make. Select XY (Scatter).
- Go forward two steps by clicking the “Next” button at the bottom of the chart wizard box. You will come to the chart options box in which you must enter the title of your chart and labels for the x and y axes. Enter these now. (Chart title: Number of Species vs. Number of Sites; Value (X) axis: Number of sites visited within park; Value (Y) axis: Number of species recorded in park)
- Before moving on by clicking the “Next” button, click on “Legend.” Deselect the “Show Legend” box. Then click “Next.”
- In the next box, simply accept the default option to create your chart as an object in sheet 1. When you click “Finish” your new graph should appear on your worksheet!